
What is Share Fundamental Analysis?
Fundamental analysis of shares is like peeking behind the curtain of a business understanding not just what it does, but how well it does it, and whether it’s built to last. In simple terms, share fundamental analysis helps investors figure out whether a company is worth the price it’s trading at on the stock market.
In 2025, where markets are more dynamic than ever, learning this skill is not just smart it’s essential. Whether you’re a beginner or someone looking to sharpen your skills, understanding the real value behind the numbers can make all the difference in your investment journey.
Table of Contents
Why It Matters in 2025
With AI-powered trading bots, global uncertainty, and rapidly shifting industries, it’s easy to get swept up by hype or fear. Fundamental analysis grounds you in facts earnings, assets, debt levels, and growth potential rather than emotion or speculation. This is your compass in a market full of noise.
Key Differences Technical vs Fundamental Analysis
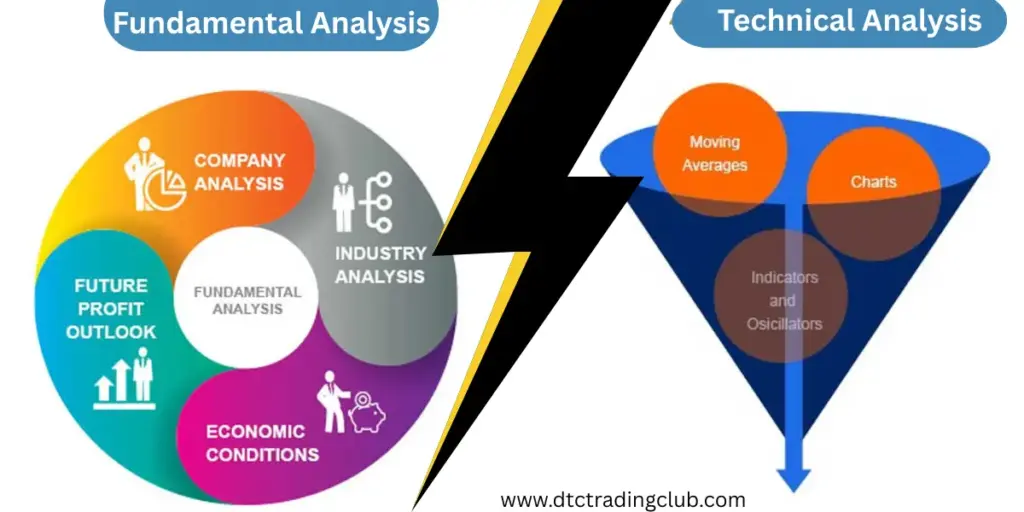
One of the biggest beginner questions is “What’s the difference between technical and fundamental analysis?” And which one should you use?
When to Use Each Method
| Analysis Type | Focus | Ideal For |
| Technical | Price patterns, charts, volume | Short-term traders |
| Fundamental | Company financials, industry health | Long-term investors |
Pros and Cons
Technical Analysis Pros:
- Great for timing entry/exit points
- Works well in fast-moving markets
Fundamental Analysis Pros:
- Helps identify undervalued stocks
- Encourages long-term thinking
But why choose? Many savvy investors in 2025 are blending both methods for a complete picture.
The Core Principles of Fundamental Analysis of stocks
Let’s unpack the basic philosophy behind fundamental analysis of stocks:
- Intrinsic Value: This is the “true” value of a stock, based on its future cash flows, earnings, and business model — not just the market price.
- Margin of Safety: Buying a stock when it’s priced below its intrinsic value gives you a safety cushion.
- Qualitative vs. Quantitative:
- Quantitative: Numbers revenues, profit margins, debt, etc.
- Qualitative: Business model, leadership quality, and brand strength.
When combined, these give a full 360-degree view of a company’s potential.
Must-Know Financial Ratios for Beginners
Let’s face it financial statements can be intimidating. But if you learn just a few key ratios, you can quickly get a grip on a company’s health.
Essential Ratios to Know
- Earnings Per Share (EPS): A higher EPS generally shows that the company is making more profit for each share, which is a good sign of strong financial performance.
- Price-to-Earnings (P/E) Ratio: This ratio helps you understand whether a stock is priced fairly — it tells you if investors are paying too much or getting a good deal based on the company’s earnings.
- Debt-to-Equity Ratio: Shows how risky a company is in terms of debt.
- Return on Equity (ROE): ROE shows how well a company is using the money invested by its shareholders to generate profits — the higher it is, the better the company is at turning investment into earnings.
These ratios are like cheat codes for understanding financial strength at a glance.
How to Read and Analyze Financial Statements
You don’t need to be a CPA to get this right. Here’s a beginner’s breakdown:
Income Statement
Tells you how much the company earned vs. spent over a period.
Balance Sheet
Snapshot of what a business owns and owes assets vs. liabilities.
Cash Flow Statement
- It shows how much real cash is moving in and out of the business — not just what looks good on paper, but the actual money the company is handling.
- Use all three together to get the full picture earnings can be manipulated, but cash flow rarely lies.
The Role of Management and Corporate Governance
Even if a company has solid numbers, poor leadership can tank everything. In 2025, where transparency and ethics matter more than ever, evaluating management quality and governance practices is vital.
What to Look for in Management:
- Track Record: Has leadership successfully navigated crises?
- Vision & Strategy: Are they innovating or stuck in the past?
- Shareholder Communication: Do they issue clear reports, earnings calls, and updates?
Corporate Governance Red Flags:
- Frequent management changes
- Lack of independent directors
- Overly generous executive pay not linked to performance
Remember, you’re investing not just in numbers, but in people running the business.
Industry & Economic Analysis: The Bigger Picture

No company operates in a vacuum. Even a well-run business can struggle if the industry is shrinking or the economy is tanking.
Industry-Level Insights:
- Use tools like Statista or IBISWorld to study trends
- Compare peers: is the company outperforming the industry?
Key Economic Indicators to Watch:
- Interest rates (affects borrowing costs)
- Inflation (eats into profits)
- Consumer confidence (affects demand)
2025 has brought a mix of AI-driven growth, green energy booms, and global volatility knowing how your target stock fits in helps you zoom out for smarter decisions.
How to Pick Stocks Like a Pro
When seasoned investors talk about “stock picking,” it’s not guesswork — it’s structured.
A Pro’s Checklist:
- Strong earnings history
- Low debt levels
- Competitive edge (brand, tech, patents)
- Favorable industry position
- Undervalued price based on intrinsic calculations
Warren Buffett didn’t get rich trading daily. He got rich buying great businesses at a fair price and holding. That’s the power of smart, fundamentally based stock selection.
How to Pick Shares to Invest In
Here’s a simplified system any beginner can use:
Step-by-Step:
- Use a Stock Screener: Filter companies with strong fundamentals.
- Check the Business Model: Is it scalable and future-ready?
- Look for Moats: Does the company have a sustainable advantage?
- Read Analyst Reports: Use platforms like Moneycontrol, Tickertape, or Morningstar.
Bonus Tip: Stick to sectors you understand whether it’s FMCG, tech, or pharma.
How Long-Term Investors Use Fundamental Analysis
Long-term investing is about planting seeds today and watching them grow over years. Think of it like gardening you don’t dig up the plant every day to see if it’s growing.
Real Example:
A retail investor bought Asian Paints in 2011 when it was undervalued and held it for 10 years. With consistent growth, it became a multi-bagger.
That’s the magic of fundamental analysis identifying value before the crowd catches on.
Tools & Platforms for Easy Stock Analysis in 2025
You don’t need to be a spreadsheet wizard anymore. Today’s tools are intuitive and powerful.
Top Tools:
- Tickertape: Great for filtering and visual fundamentals
- Screener.in: Free and highly detailed
- TradingView: Combines technical and fundamental charts
- Simply Wall St: Uses infographics for easy understanding
Each of these helps you decode complex numbers into visual insights.
Real-Life Examples of Fundamental Stock Analysis
Let’s walk through an actual mini-case study:
Stock Example: Tata Elxsi (2020-2024)
- EPS Growth: From ₹18 to ₹60+
- P/E Ratio: Initially under 30, now close to 60+
- Reason for Growth: Digital transformation demand, strong IP portfolio
If an investor had analyzed Tata Elxsi’s fundamentals early, they could’ve identified it as a high-growth candidate and enjoyed massive returns.
Avoiding Common Mistakes in Fundamental Analysis
Don’t:
- Ignore Red Flags: High debt, accounting inconsistencies
- Fall in Love with a Stock: Always review quarterly
- Overanalyze: Don’t get “analysis paralysis.”
Do:
- Verify Sources: Use credible data
- Think Long-Term: Fundamental investing is not for day traders.
- Compare With Peers: Always benchmark against the sector
Mistakes are part of the journey the goal is to learn and refine as you grow.
Combining Technical and Fundamental Analysis
Many investors now use a hybrid approach. Here’s how:
Fundamentals First, Technicals Next
- Fundamental Analysis: Choose what to buy
- Technical Analysis: Decide when to buy
Example: You identify a fundamentally strong stock, then wait for a support level or bullish pattern to enter. This reduces risk and maximizes entry timing.
Creating a Smart Investment Strategy
You’ve analyzed the stock now what?
Build Your Portfolio Smartly:
- Diversify: Don’t put all eggs in one sector
- Rebalance Quarterly: Track performance and shift as needed
- Set Goals: Retirement, wealth-building, passive income?
FAQS:
1. What is share fundamental analysis and why is it important?
ANSWER: Think of share fundamental analysis as getting to know the heart and soul of a company before investing your money. It’s all about digging into the company’s financial health, leadership, business model, and future growth potential. Why is it important? Because it helps you separate hype from reality — making sure you’re investing in solid businesses that are built to grow, not just stocks that are trending today. It’s your tool for making smart, confident, and long-term investment decisions.
2. What is the difference between technical vs fundamental analysis?
ANSWER: Fundamental analysis examines company financials—earnings, assets, liabilities, and management—to assess intrinsic value and long-term potential.
Technical analysis studies past price trends, trading volume, and chart patterns to predict short-term price movements.
For long-term investors, fundamentals offer the strategic foundation, while technical tools can help with entry/exit timing. A combined hybrid approach often works best.
Conclusion: Your Path to Confident Stock Investing
Learning share fundamental analysis isn’t just about reading balance sheets it’s about understanding what makes a company tick. In 2025, with more tools, data, and access than ever, any individual can become an informed investor.
And remember: You’re not just buying a stock — you’re investing in a business.